Tipoff History by Team 2025-26: Lakers 61% to Brooklyn 37%
 Available in US
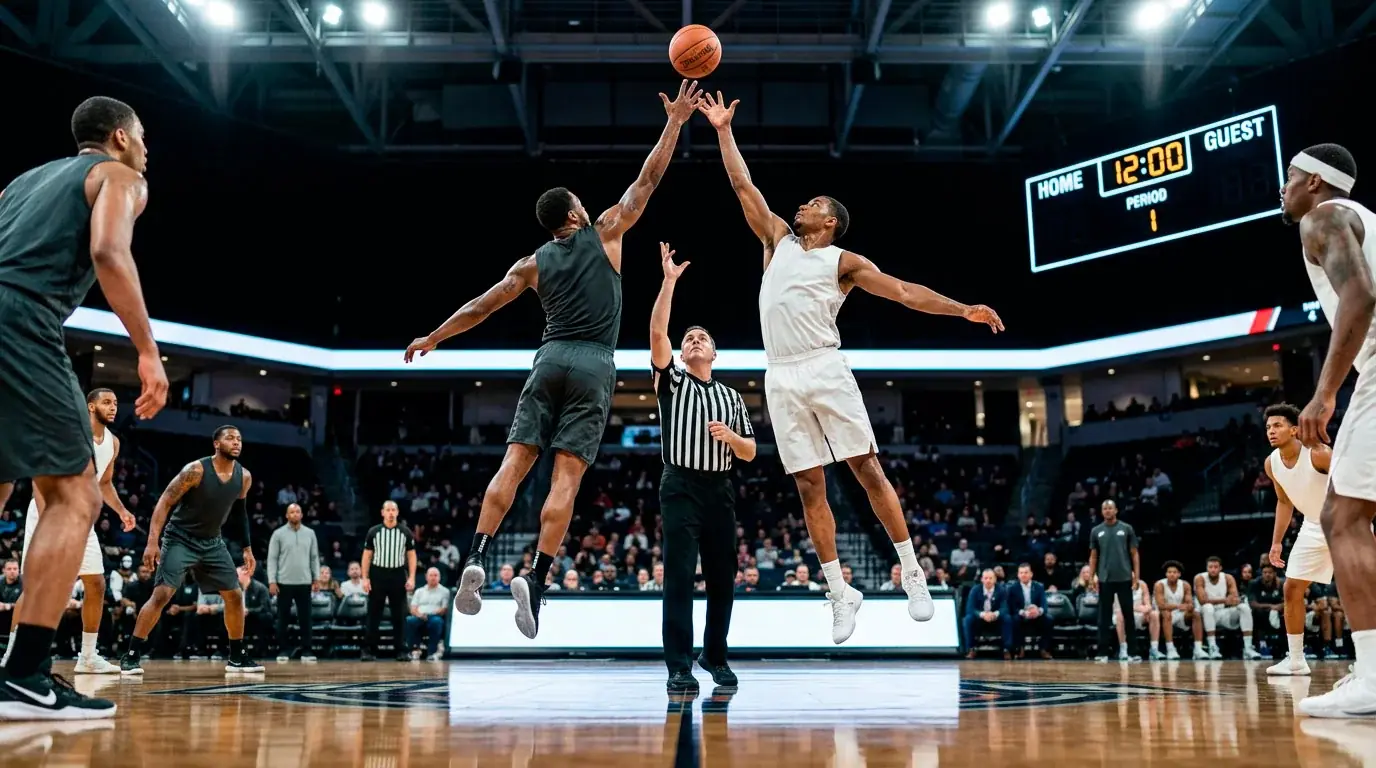
The 25-Point Spread Hidden in the Opening Jump
If somebody told me a season ago that the gap between the best and worst NBA team at winning the opening tipoff was 25 percentage points, I would have asked them to check their math. A coin flip is supposed to be a coin flip. A jump ball, in theory, is symmetric – two players, one referee, one ball. Yet the data is unambiguous. During the 2024-25 season the Los Angeles Lakers won 61.3% of opening tip-offs while the Brooklyn Nets won only 36.5% – a 24.8-point spread that does not happen by chance and that any UK first basket bettor needs to know cold.
The reason the spread matters is downstream. Roughly 64% of first baskets are scored by the team that wins the opening tip – a number that emerged from one of the largest tipoff studies ever published. So a 25-point gap in tipoff-win rate translates into a meaningful gap in team first basket probability before you even start looking at individual player rates. If you are betting on first basket player markets and you ignore the team-level tipoff data, you are leaving expected value on the table on every game.
This piece is a working registry of the team-by-team tipoff landscape: the Lakers end of the spectrum, the Nets end, the cluster of teams in the middle, why the spread exists, and how to keep your team-level data current as the season progresses. The framework is not glamorous, but it is the input that goes into every responsible first basket model, and most UK bettors I see still treat the tipoff as a 50-50 they do not need to model.
The Lakers End of the Spectrum
The Lakers’ 61.3% tipoff-win rate in 2024-25 is the kind of number that, on its own, justifies an entire bankroll allocation strategy. Six tips out of every ten go their way. The reason is structural rather than luck-based, which is what makes the data sticky from year to year. The Lakers have, across multiple seasons, fielded centres with timing, height, and athletic profiles that consistently win opening jumps against most matchup centres in the league.
The team-level dominance translates directly into Lakers player first basket markets being priced higher than they would be on a team with neutral tipoff outcomes. If a Lakers wing has, say, a 22% career first-basket rate independent of tip outcome, the actual first-basket probability when they tip off as the favourite to do so is closer to 25-26% – because the team is winning more opening possessions than the league average and the opening possessions disproportionately end in the team’s first basket.
What you need to watch for in 2025-26 is whether the Lakers’ tipoff dominance is preserved. Roster changes, particularly at the centre position, can shift team tipoff rates by ten or more percentage points in a single off-season. The 61.3% rate from 2024-25 is the starting prior; the in-season data either confirms or revises it. By around game 15 of the new season you have enough data to update meaningfully – before that, you are still trading mostly off the prior year’s number.
Other teams that historically sit in the upper end of the tipoff distribution include the San Antonio Spurs, who have run at 77% tipoff-win rates in recent samples on the back of Victor Wembanyama’s reach advantage, and the New York Knicks, whose 2024-25 tipoff data showed Jalen Brunson taking 23.8% of his team’s opening shots with the Knicks winning the opening tip at 53.4% and converting that to a 61.4% team first-basket rate.
The Nets End of the Spectrum
The Brooklyn Nets at 36.5% in 2024-25 are the inverse mirror of the Lakers. Six tips out of ten go to the opponent. The reason is again structural – Brooklyn has not had a centre profile that consistently wins jumps in the relevant sample, and matchup-by-matchup the team has been at the wrong end of most opening jumps. The losing rate is remarkably stable across stretches of the season, suggesting it is not random variance but a persistent matchup feature.
For a UK first basket bettor, the Nets-end teams are interesting in two ways. First, their players are systematically over-priced when the operator’s model gives full weight to historical first-basket rates that did not control for tipoff outcome. The Nets player who has a career 18% first-basket rate is closer to 14-15% effective probability when you correct for the team winning fewer opening tips. So the Nets first basket favourites are typically slightly overpriced and the Nets opponents’ favourites are slightly underpriced.
Second, the Nets-end teams are useful for opposite-side bets. If you are looking at a game between the Nets and a tipoff-strong opponent, the implied probability that the opening possession goes to the opponent is high enough that the opponent’s first-shot taker becomes a stronger value play than you would price from raw player rates alone.
Other teams that historically cluster near the bottom of the tipoff distribution include several rebuilding rosters where the centre position has been turning over rapidly, plus a handful of teams whose starting fives mismatch against the league’s typical jump-ball winners. The cluster shifts year-to-year more than the top end does, because rebuilding teams have higher roster turnover and the centre position is volatile.
Mid-Table Clusters
The middle of the league is where most teams sit, and where the tipoff data is least useful as a single signal. Teams in the 47-53% tipoff-win range – which in any given season covers maybe 18-20 of the 30 teams – are essentially neutral on tipoff outcome, and the variance from game to game on individual matchups overwhelms the small team-level edge.
For UK bettors, the implication is that team-level tipoff data is highly informative for the eight to twelve teams at the extremes (the top six and bottom six in the distribution) and only modestly informative for the eighteen-to-twenty teams in the middle. Spending energy modelling tipoff outcomes for a Hawks-Pistons game, where both teams sit close to 50%, returns less per minute of analysis than spending the same time on the Lakers-Spurs matchup where two upper-end teams are colliding.
Inside the mid-table, individual matchup data starts to matter more than season averages. A team that runs at 49% on the year may be 65% against opponents with smaller centres and 33% against opponents with longer ones. The matchup-specific data is where mid-table teams stop looking like coin flips and start producing tradeable edges, but the work to extract it is more granular and more time-intensive than the simple team-average lookup.
Why the 25-Point Spread Exists
The reason a coin-flip-shaped event produces a 25-point spread between best and worst teams is that it is not really a coin flip. The opening jump ball is a contested timing-and-reach event between specific pairs of players, with the referee’s toss height being the only random component. Once the ball is in the air, the outcome is determined by reach (height plus arm length plus jump height), timing (the ability to peak at ball position simultaneously), and contact strategy.
The structural drivers of the league spread are dominated by player profile. Some teams field centres whose vertical leap and timing wins jumps at 60%-plus rates against most opponents. Others field centres whose physical profile is built for other parts of the game and who lose most opening jumps as a side-effect. Once you understand that the jump ball is essentially a matchup question between two specific players, the league-wide spread of 24.8 points stops being surprising.
The 60% vs 40% range I have referenced – some NBA teams win the opening tipoff over 60% of the time while others hover around 40%, a 20 percentage-point swing critical for first basket value – captures the cleaner middle range of the distribution where most useful trading lives. The Lakers’ 61.3% and the Nets’ 36.5% are the extreme ends; the 60% vs 40% framing is the practical bettor’s working frame for the bulk of strong-versus-weak matchups.
The other structural driver is coaching. Some teams use the opening play differently, drilling specific tap targets or wingmen positioning to convert won tips into clean first-shot opportunities. Others let the tip play out organically. The teams that drill it have higher conversion rates from won tips into first baskets, which compounds the team-level edge on the front end of the play.
How to Update Data Mid-Season
Team tipoff data has a slow update cadence in absolute terms – fifteen games is the rough sample after which you start to trust the in-season number – but the priors from the prior season are generally durable, particularly at the extreme ends of the distribution. The Lakers will not flip from 61% to 40% in one off-season unless the centre position has fully turned over. The Nets will not flip from 37% to 60% unless they have signed a high-impact tipoff specialist. The middle moves more, but the extremes are sticky.
The practical update routine I run is simple. At the start of each season, I write down the prior-year tipoff win rate for every team. By game 10, I check the new in-season rate against the prior. If the in-season rate is within 8 percentage points of the prior, I keep the prior as the working estimate. If it has diverged by more than 8 percentage points, I weight the in-season data more heavily and start moving toward the new number.
By game 25, I have enough in-season data that the new-season rate is the dominant input and the prior-year rate is just a sanity check. By the All-Star break, the in-season rate is fully trusted as the working estimate for the rest of the season. The cadence balances respecting prior-year information against not anchoring too hard on a stale number after meaningful roster changes.
Cross-checking matters because the data sources I use sometimes disagree by one or two percentage points depending on how they handle edge cases – overtime tipoffs, jump balls after dead balls, possession-arrow situations. The differences are small but they add up across thirty teams, and when you are sizing bets off implied probability differences of a few percentage points the cleanliness of the input data becomes important.
The team tipoff data feeds directly into the more granular question of which coaches consistently extract value from won tips and which let opening possessions drift, and the coaching-side analysis is the natural complement to the team-level numbers in this article – I have laid out the systematic patterns in coaching tendencies on opening play.
The Tipoff as a Compounding Edge
The team-level tipoff data is not a magic input that turns first basket markets into easy money. It is an edge worth several percentage points of accuracy on the team-level probability for any given game, and that edge compounds across many games into a meaningful long-run improvement in betting outcomes. The teams at the extreme ends of the distribution are where the data adds most value; the teams in the middle are where additional matchup-level work is needed before the data is useful.
The simplest practical takeaway: if you are not yet using team tipoff data in your first basket prep, start with the eight or ten teams at the extremes – the four to five strongest tipoff teams and the four to five weakest. Those extremes will affect your line evaluation on roughly a third of the season’s games, and that is enough to make a measurable difference in your long-run expected value.
Does winning the tipoff guarantee scoring the first basket?
No, but it shifts the probability significantly. Studies of large samples of NBA games show roughly 64% of first baskets are scored by the team that wins the opening tip, leaving 36% to the team that loses it. The tipoff is a meaningful but not deterministic input.
How quickly do team tipoff rates change between seasons?
The extreme ends of the distribution – the strongest and weakest tipoff teams – are generally sticky from year to year unless the centre position has turned over. The middle of the distribution moves more, with team rates shifting by 5 to 10 percentage points being common across off-seasons that involve roster changes.
Published by the nba First Basket Bets team.