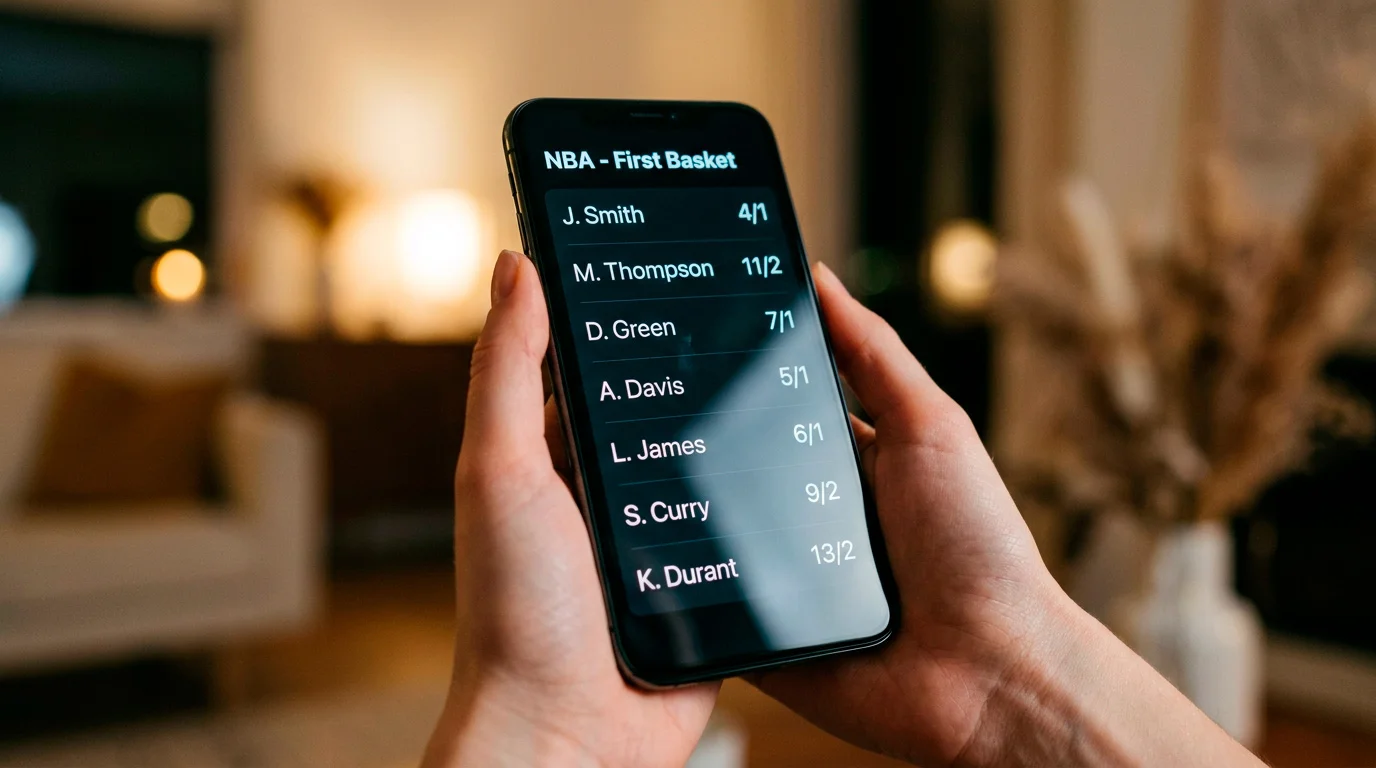
Record Keeping for UK Prop Bettors: Tracking First Basket Bets to Prove Edge
 Available in US
- Why You Cannot Prove Edge Without a Spreadsheet
- What Fields to Track on Every Bet
- Manual vs Tool-Based Tracking: What Actually Works
- How Many Bets Before the Data Means Anything
- Calculating ROI and Yield Without Fooling Yourself
- What to Do With the Data Once You Have It
- The Habit That Outlasts the Curiosity
Why You Cannot Prove Edge Without a Spreadsheet
The most uncomfortable conversation I have with new prop bettors goes like this. They tell me they have been profitable for six months on first basket bets. I ask to see the records. They tell me they remember the wins clearly and have a rough sense of the losses. I ask whether they have a spreadsheet. They do not. Within two minutes I have to break the news that they cannot actually prove they are profitable, because human memory is biased toward wins on high-variance markets, and they have just been telling themselves a story.
Record keeping is the boring half of every successful UK prop bettor’s routine, and it is the half that separates skill from luck on a market where 80 percent of bets miss by design. Without a tracker you cannot calculate ROI, cannot identify which player types or match-ups produce your edge, cannot satisfy any kind of self-evaluation, and cannot tell whether a bad month is variance or a genuine loss of edge. The maths is unsentimental. The spreadsheet is the only honest witness.
This guide walks through what to track, how to track it, what sample size means anything, how to calculate ROI and yield correctly, and what to do with the data once you have a few hundred bets logged. Nothing fancy. Just the discipline that compounds.
What Fields to Track on Every Bet
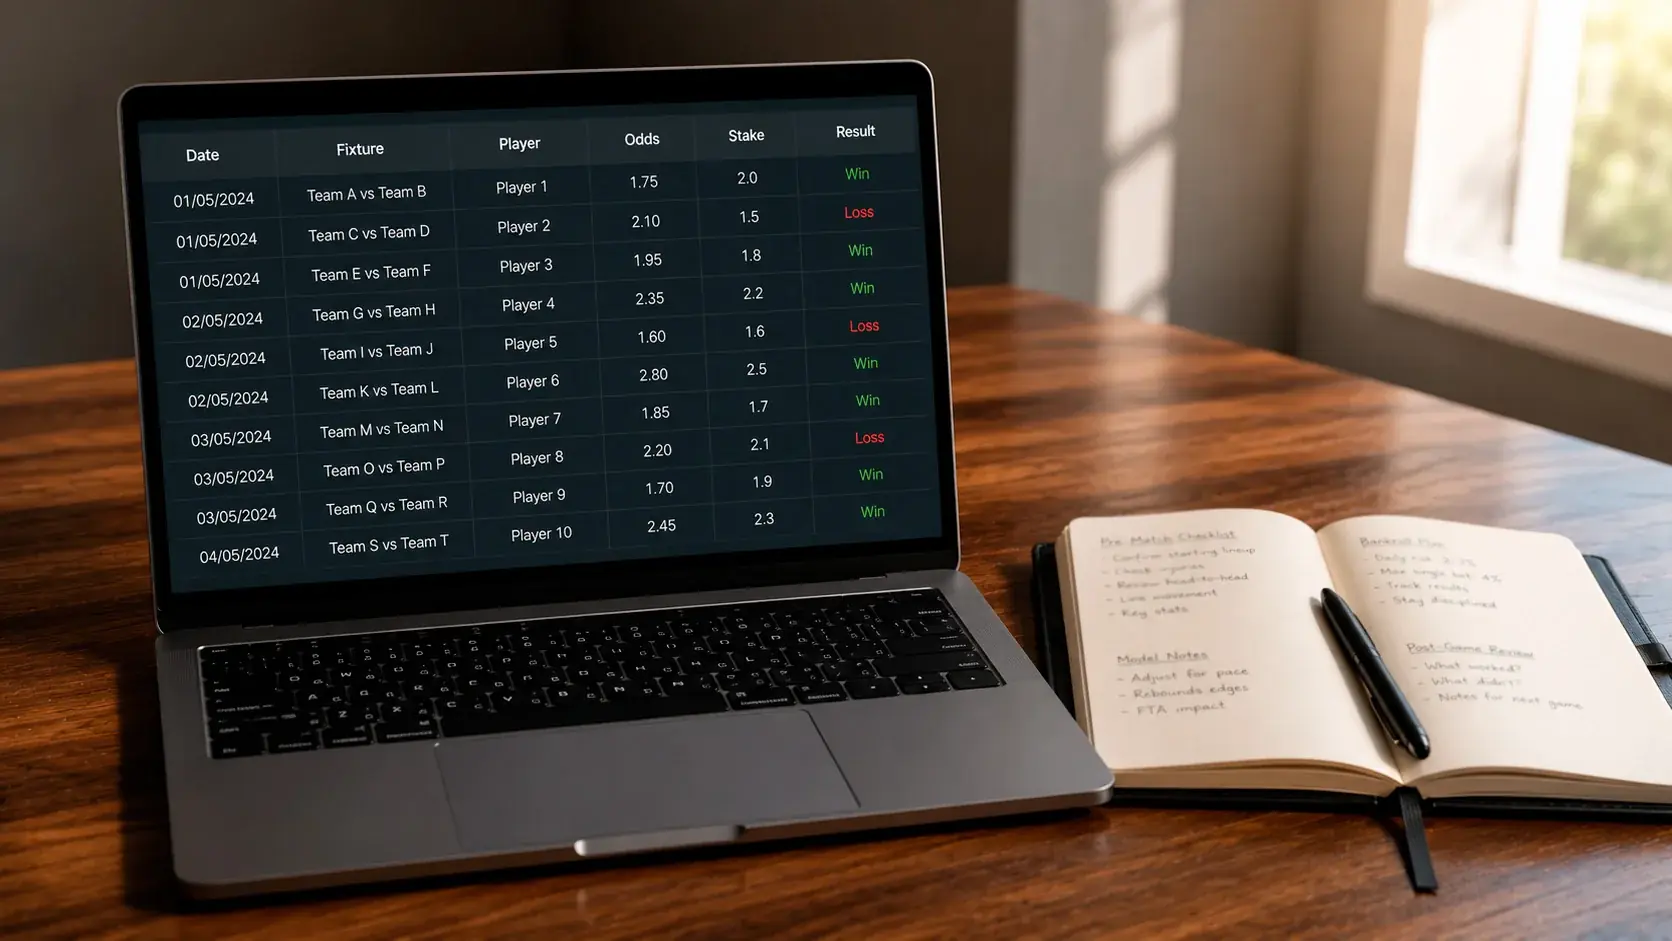
The minimum useful tracker has eight columns. Add more if you like, but do not subtract; each one earns its place because removing it blinds you to a specific question you will eventually want to answer.
Date and tipoff time. Trivial to log, essential for filtering by month or by night-of-week patterns later. UK punters often discover that their late-tipoff bets perform differently from their early-tipoff bets – fatigue, less research time, drink. The data tells you which.
Fixture, in the form Home vs Away. Lets you slice by team match-up afterwards. Some teams’ games produce repeatable first basket patterns; others are scattered. You will not see this without the column.
Player named on the bet. Obvious, but log it consistently – same spelling every time, no abbreviations, so you can pivot by player without cleaning data later.
Decimal odds and operator. The odds at the moment you placed the bet, not the closing line. The operator name lets you track which UK book is offering you the best prices over time, and which one has been quietly giving you worse prices than its competitors.
Stake in pounds, and stake as a percentage of bankroll on the day. Both numbers matter. Pounds are what affect your account; percentages are what affect your bankroll trajectory.
Result column with three states: win, loss, void. The void state matters more than people think, because void rules differ across UK operators and you will eventually want to audit how often a particular operator voids bets you assumed would settle.
Returned amount, which is stake plus profit on a winner, stake on a void, zero on a loss. This is the column that feeds every ROI calculation downstream.
Notes. One sentence, free text. Why I placed the bet, what the read was, anything unusual about the fixture. The notes column is the one that turns a bet log into a learning tool. Without it, you have a record; with it, you have a journal.
Manual vs Tool-Based Tracking: What Actually Works
I have tried both. Manual spreadsheets and dedicated tracking apps. After three seasons of switching between them I have landed on a hybrid, and the reasoning is worth sharing because most online advice on this topic skips it.
Manual spreadsheets – Google Sheets or Excel – win on flexibility. You can add columns, build pivot tables, run filters and write your own formulas. The cost is friction. Every bet has to be entered by hand, usually after the fact, and the moment you forget to enter three or four bets in a busy week your data is corrupt. Manual tracking demands the kind of consistency that very few punters maintain past month three.
Dedicated apps win on data hygiene. Many of them auto-import bets from connected accounts, calculate ROI in real time, show you a graph of your bankroll over time and produce by-player and by-market breakdowns at a tap. The cost is rigidity. The fields are fixed. The reports are pre-baked. If you want to slice by something the app does not support – say, “first basket bets placed within ten minutes of tipoff after a late injury news break” – you cannot, and you are stuck with the analysis the developer chose.
The hybrid I run uses an app for the front end of data capture and a spreadsheet for the analysis end. The app catches the bet immediately so I do not lose entries to a busy week. Once a fortnight I export the app’s data into a sheet I have built and run my own breakdowns. The fortnightly export takes ten minutes. The compound benefit is that I have data integrity and analytical flexibility at once.
Whichever you pick, the most important thing is consistency. A messy spreadsheet maintained for two years beats a beautiful one abandoned after six weeks. Pick the format you will actually keep up with, and let the tool serve the habit rather than the other way round.
How Many Bets Before the Data Means Anything
This is the question every UK punter asks once they have built their first tracker, and the honest answer is uncomfortable. First basket bets are extreme variance products. Even the most likely first basket scorer in any given game converts at less than 20 percent, while a player priced as 15 percent likely to score first will miss roughly 85 percent of attempts. That distribution means short samples tell you almost nothing about edge.
The rough mathematical answer is that you need somewhere between 300 and 500 bets at typical first basket prices before you can speak meaningfully about your ROI. Below 300, your observed return is dominated by variance – a single hot streak or cold streak swings the percentage by ten points or more. Between 300 and 500, you start to see the signal emerge, but the confidence intervals are still wide. Above 500, you can begin to make claims about your edge with reasonable statistical defensibility, particularly if your bet sizes have been roughly consistent across the sample.
For most UK recreational bettors, 500 bets translates to roughly two NBA seasons. That is a long time to wait before declaring yourself profitable, and it is exactly why so many punters convince themselves they are profitable at month four when they actually have no idea. The honest framing is to treat any sample under 300 bets as inconclusive – you might be running well, you might be running badly, and the data cannot yet tell you which.
The countervailing benefit is that once you do reach a meaningful sample, the numbers are unambiguous. ROI of plus three percent across 800 bets is real. ROI of plus three percent across 80 bets is noise. The discipline is patience: keep logging, do not draw conclusions early, and let the sample reach the size where the maths can speak.
Calculating ROI and Yield Without Fooling Yourself
ROI on prop bets is more nuanced than the single-figure ratio most punters quote. There are at least three numbers worth calculating, and they tell different stories.
The first is overall yield. Total returns minus total stakes, divided by total stakes, expressed as a percentage. This is the headline number and the one most apps display. A yield of plus two percent across a meaningful sample suggests you are extracting value from the market beyond the bookmaker’s overround. A yield of minus eight percent suggests the market is extracting value from you, which is the default state for most casual bettors and is worth knowing without flinching.
The second is yield by price band. Slice your bets into buckets – odds under 5.00, 5.00 to 10.00, 10.00 to 20.00, above 20.00 – and calculate yield separately within each band. Most UK first basket bettors discover that their edge sits in one or two specific price ranges and is negative in the others. Knowing which range produces your wins is more valuable than the headline yield, because it lets you concentrate stake where you are good and reduce stake where you are not.
The third is yield over rolling windows. Calculate three-month yield rolling across your sample. The chart shows you whether your edge is stable or whether you have been running well for a quarter and convincing yourself it represents permanent skill. Real edge is reasonably stable across rolling windows. Apparent edge that vanishes when you slide the window forward by a month is variance dressed up as ability.
The UK online betting market processes roughly 290.03 million online bets monthly in 2025, which gives a sense of the noise floor every individual bettor’s record is fighting against. Your few hundred bets sit inside that ocean of activity, and the small numbers you are tracking only become signal when you let them accumulate honestly. Shortcuts in ROI calculation – only counting your good months, ignoring void bets, smoothing out drawdowns – make the headline figure look better and the underlying picture invisible.
What to Do With the Data Once You Have It
The point of tracking is not the tracker. The point is the action you take based on what the tracker shows. Six things, in priority order.
Cut bet types where your yield is persistently negative. If your data shows a clearly negative ROI on, say, first basket bets above 15.00 decimal across 200 bets, stop placing those bets. The maths has spoken. You can re-introduce them later if your reads improve, but the default position should be that the data wins arguments against your gut.
Concentrate stake on bet types where yield is positive and the sample is reaching meaningful size. If you are running plus four percent on first basket bets in the 4.00 to 6.00 decimal range across 250 bets, that band deserves a larger share of your weekly stake budget. Not double; carefully more.
Identify the operator that is consistently giving you the best prices and route more of your volume there. UK books vary on first basket pricing, and your tracker reveals the pattern.
Audit your void rate by operator. If one book is voiding meaningfully more first basket bets than the others, ask why. Sometimes there is an innocent reason; sometimes it is worth raising with their support team.
Review your notes column quarterly. The reads that produced wins and the reads that produced losses are usually different in character, and the contrast becomes obvious when you read fifty notes back-to-back.
The drawdown analysis is its own discipline, and the framework I use for handling extended losing streaks is in drawdown and loss streaks on first basket, which complements the tracking work this article describes.
The Habit That Outlasts the Curiosity
Most punters who try record keeping last about six weeks. They build the spreadsheet, log their first thirty bets diligently, then miss a Tuesday, miss a Wednesday, miss the rest of the week, and abandon the file in November. The habit that outlasts the curiosity is the habit that gets logged in the same five minutes after every bet, win or loss, with the same tabs open and the same fields filled. Five minutes after the bet, not five days.
You are not tracking to win arguments with friends. You are tracking to win arguments with yourself, the version of yourself who at month four will want to declare victory on a sample too small to support the claim. The spreadsheet is what stops that conversation. It is also, eventually, what tells you the better news: that the work is paying, the edge is real, and the boring discipline of logging every line was the cost of knowing.
Do void bets count in ROI calculations?
Treat void bets as separate from wins and losses. The stake is returned, so the bet does not affect profit or loss, but you should still log it. A high void rate on certain match-ups or operators is a pattern worth noticing, and excluding voids from your records hides that pattern.
Should I share my tracker with anyone?
That is your call, but the data is sensitive. Bet records can show patterns that look concerning out of context – long losing streaks, period of higher-than-usual stakes – and may be misread by people who do not understand variance. Share narrowly, with people who genuinely understand the maths.
Prepared by the nba First Basket Bets editorial staff.