Basketball Conversion Metrics: calculating accurate player FB%
 Available in US

FB% Formula Implementation: Adjusting for Home-Court and Tipoff Variables
Two seasons ago I asked a bettor friend in Manchester to define FB%. He said: “the percentage of times a player scores in a game?” Close, but no. FB% is the percentage of starts in which a player himself scored the first basket of his team’s game – and the difference between that and any other shooting metric is the difference between betting on guesswork and betting on math. Without an FB% number, every implied probability calculation you perform is hanging in mid-air.
I want to walk through the manual calculation here because almost no UK-facing source explains it in a way that lets you actually compute it for yourself. The data is publicly available – game logs, play-by-play feeds, basic team box scores – but the methodology is buried in academic studies and proprietary models. So you end up trusting other people’s FB% numbers without knowing how they were computed. That is not a position any disciplined bettor should accept.
Here is what we are going to cover: the data inputs you need to build a working FB% model, the base formula in its simplest form, the two adjustments that matter most (tipoff result and home-versus-away), and a worked example end-to-end using a real player profile. By the end you should be able to compute FB% for any NBA player who has logged at least 30 starts in the current season.
What data you actually need to compute FB%
The data hunt is the part that puts most casual bettors off, and it should not. You need three columns from each game in your sample: the game date, whether the player started, and the identity of the player who scored the first basket. That is it for the base calculation. The first two columns come from any standard NBA game log; the third comes from play-by-play feeds, which are publicly accessible on basketball-reference.com, NBA.com’s stats portal, and several free aggregator sites.
The minimum sample size for a meaningful FB% number is 30 starts. Below that you are looking at noise – first basket events are rare enough that a 20-start sample can show a player at anywhere from 8% to 30% by random variance alone. At 30 starts you are getting closer to a stable estimate; at 60 starts you have something you can confidently use as a betting input. Wembanyama’s 2025-26 playoff write-up showed a 20.7% first-basket rate across 58 starts, which is right around the threshold where the number becomes reliable.
The three columns above give you the base FB%, but for adjustments you also want to capture: whether the player’s team won the opening tipoff, whether the game was home or away, and which centre matched up against your player’s team in the tipoff. With those five columns you have the input layer for a working model. Without them, you are computing a base rate that does not adjust for context – which is better than nothing but leaves edge on the table.
One practical tip – building this dataset manually for a single player takes about 90 minutes per season. Painful but doable. Building it for a 20-player watchlist is a 30-hour project. At that point most disciplined bettors switch to scraping the data, but for a starting bettor the manual route teaches you what is going on under the hood.
The base formula and how to interpret the result
The base FB% formula is the count of games in which the player scored the first basket, divided by the count of his starts in the sample, multiplied by 100. So a player with 12 first baskets in 58 starts has an FB% of (12/58) × 100 = 20.7%. That is the headline number – your fair-value reference rate before any adjustments.
Interpreting the result against the league baseline is essential. Teams that won the opening tipoff scored the first basket 64% of the time, according to academic regression analysis of NBA play-by-play data covering ~13 million events. Each team has roughly five players on the floor at tipoff, so the average individual player’s contribution to the team’s first basket is roughly 64% divided by 5, or about 12.8%. Anything significantly above 12.8% is a player whose team scripts him into opening possessions; anything significantly below is a player whose team scripts away from him.
The Dickinson College research team’s lead, Bilen, framed the regression result this way: “Yes, the weight of a single chance event at the start of the game is small compared to everything else that happens throughout, but we’re capturing more than just the tipoff.” That insight matters because FB% is not a pure tipoff metric – it captures the player’s role on the opening possession, which is partly tipoff-driven and partly play-design-driven. The two layers compound.
So when you compute FB% for a player and get, say, 15.5%, you are seeing a player slightly above the league-average individual contribution – which means his team is mildly scripting him into the opening possession. When you get 21%, you are seeing a player whose team is heavily scripting him. When you get 8%, you are seeing a player whose role is essentially elsewhere in the offence – likely a stretch shooter or a defensive specialist who happens to start.
Adjusting FB% for the tipoff result
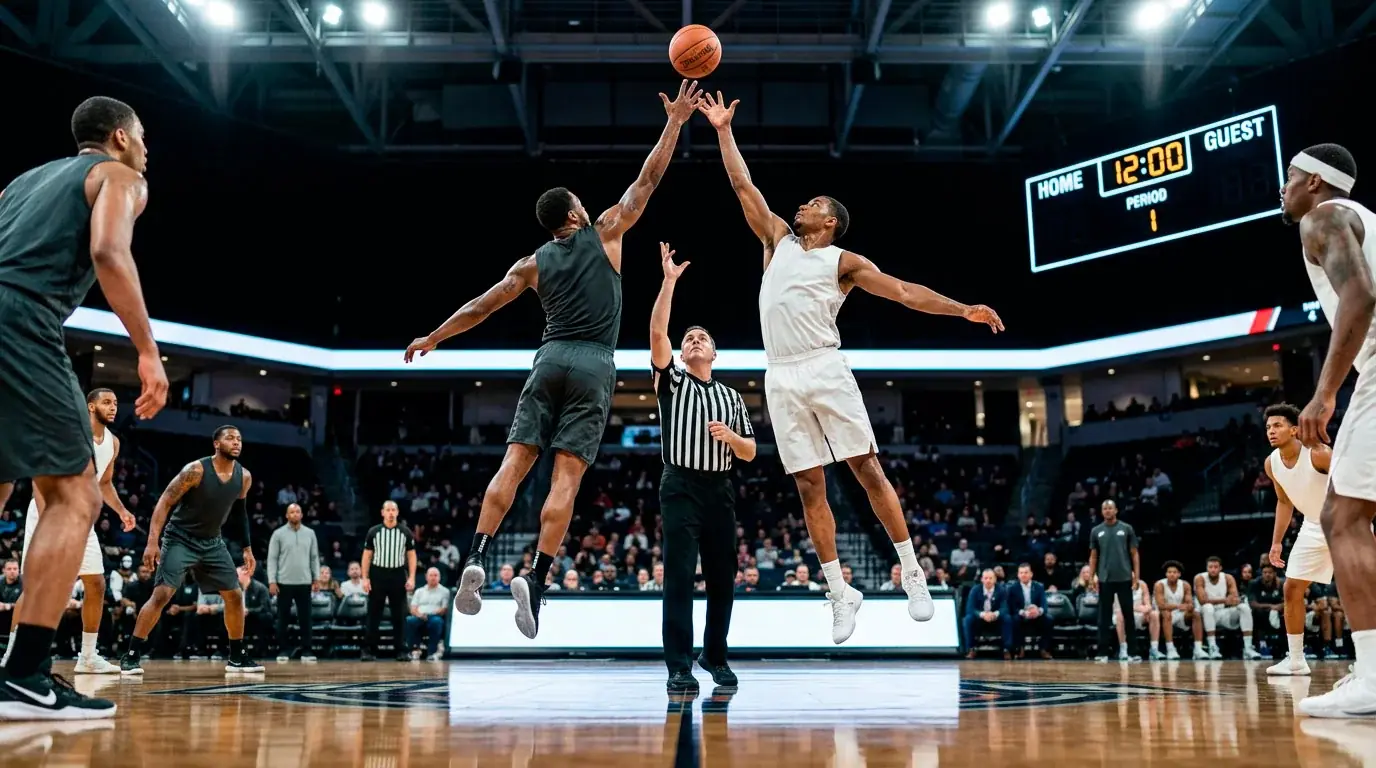
The base FB% averages across games where the player’s team won the tipoff and games where they lost it. But teams that win the opening tipoff scored the first basket 64% of the time – meaning they convert at roughly 1.78 times the rate of teams who lost the tip. So the player’s true FB% conditional on winning the tip is materially higher than his average FB%, and conditional on losing the tip is materially lower.
To compute the tip-conditional adjustment, split your sample into two: starts where the team won the tip, starts where they lost it. Compute FB% for each subset separately. The result is two numbers – call them FB% (tip won) and FB% (tip lost). The first number is what you actually care about on most betting nights, because the second is so much lower that the player is rarely a value bet when their team is expected to lose the tip.
For Wembanyama, with the Spurs winning the opening tip 77% of the time during his 58-start sample, the FB% adjustment is small because the unconditional and tip-won numbers are close. For a player on a team that wins 50% of tipoffs, the gap between unconditional FB% and tip-won FB% is much wider – sometimes 5-7 percentage points. That gap is the entire reason you should never bet first basket without first checking the expected tipoff result.
Adjusting FB% for home versus away
Home-court advantage on first baskets is real but smaller than people assume. The pattern shows up because home teams script the opening possession more aggressively, the home crowd creates marginally tighter defensive errors on the away team’s first set, and the home team’s centre tends to win the tipoff at a slightly higher rate than the away centre. The aggregate effect on individual FB% is typically 1-2 percentage points.
Some players show much larger home-away splits because their opening role is tied to a specific home-court routine that does not travel well. Others are nearly identical home and away. Without splitting your data you cannot tell which type of player you are looking at, so the adjustment is worth running even when the average effect is modest.
The way to compute it is identical to the tipoff adjustment: split the sample by location, compute FB% for home games and FB% for away games separately. Then weight the two numbers by the relevant context for the bet you are about to place. If your player is at home tonight, you use the home FB% as your reference. If away, you use the away.
A worked example end to end
Let me walk through a fully worked example using Jalen Brunson’s profile as the base. Brunson posted a 21.2% first-basket rate across 80 starts and took 23.8% of his team’s opening shots; the New York Knicks won the opening tip at 53.4%, converting to a 61.4% team first-basket rate.
Step one: the unconditional FB% is 21.2%. Step two: split by tipoff result. If Knicks team first-basket rate when winning the tip is, say, 75% (calculated from the 61.4% overall rate combined with the 53.4% tipoff win rate), and Brunson takes 23.8% of opening shots, then his conditional FB% on tip-won games is approximately 0.75 × 0.238 × adjustment factor, which lands somewhere around 25-27% in real terms. Step three: split by location. If Brunson’s home FB% is 23% and away FB% is 19%, you use whichever applies tonight. Step four: combine the tip-conditional and home-away adjustments. The output is a single number – your true expected FB% for tonight’s specific game.
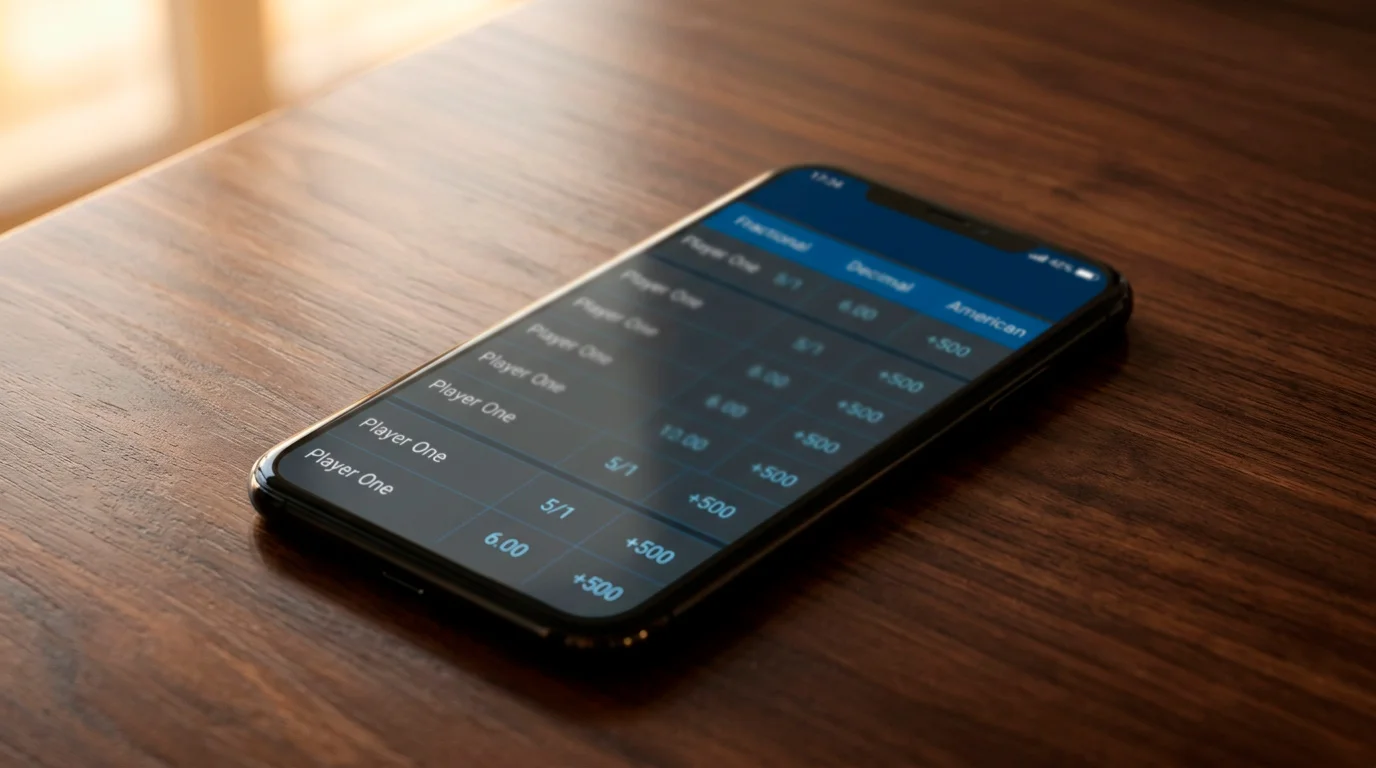
Compare that final number to the implied probability of the price on offer. If Brunson is priced at 6/1 (14.3% implied) and your conditional FB% comes out at 24%, you have a 9.7 percentage point edge – a strong value bet. If the price is 4/1 (20% implied), the edge shrinks to 4 points – still positive, but tight. Cross-checking the conversion against the price is the entire purpose of computing FB% in the first place; the model only earns its keep when you actually compare the output to the line.
How many starts do I need before FB% becomes meaningful?
Thirty starts is the practical minimum. At that point random variance has settled enough that the number reflects something real. Sixty starts gives you a confident estimate. Below thirty starts the number is too noisy to use as a betting input.
Should I include playoff and regular-season games in the same FB% calculation?
No. Playoff opening-possession scripting differs from regular-season scripting because rotations tighten and stars take more opening shots. Compute regular-season FB% and playoff FB% separately and use whichever applies to the game you are betting on.
Written by the editors at nba First Basket Bets.