Implied Probability for First Basket Odds: Translating +400, +800 and +1500 into Real Numbers

Table of Contents
- The five seconds of mental arithmetic that separate winners from punters
- The formula in three formats – and which one to use when
- +400 decoded – the favourite-tier first basket price
- +800 and +1500 – the longshot zone where most volume sits
- Comparing implied probability against actual first basket conversion rates
- The vig and overround on first basket markets
The five seconds of mental arithmetic that separate winners from punters
I learned the implied-probability conversion the slow way – by writing out long division on a Sky Bet betslip in 2014 and realising halfway through that the price I had just clicked was offering me a 9% implied probability on a player I had modelled at 7%. I cancelled the bet and went looking for a sharper line. Twelve years later, the same calculation takes me five seconds in my head, and it is the single most important habit I can teach a UK first basket bettor.
Implied probability is the bridge between the price on a bet slip and the actual chance of an event happening. Without it, you are guessing whether 6/1 is generous or punishing on a given player. With it, you can compare any UK book’s first basket price to your own model in a common currency – the percentage probability you are buying with each pound staked. There is no betting edge of any kind without first being able to do this conversion.
What follows is the practical math. The formulas in decimal, fractional and American formats. A worked example at +400, another at +800, and a third at +1500 to cover the full UK first basket pricing range. The cross-check against actual first basket conversion rates so you can tell value from trap. And finally, the vig and overround layer that determines how much edge the book is taking before you even see the headline odds.
The formula in three formats – and which one to use when
UK sportsbooks display first basket odds in three formats, sometimes interchangeably depending on which mode the user has selected. Decimal odds are the operator default in most of Europe – a price like 7.00 means a £1 stake returns £7 total, including the original stake. Fractional odds are the British inheritance – 6/1 means £6 profit on a £1 stake, with your original stake returned on top. American odds are the format US sources use – +500 means £500 profit on a £100 stake, while -110 means £100 risked to win £91.
The implied probability formula in decimal is the cleanest: 1 divided by the decimal price, multiplied by 100. So a price of 7.00 implies 1/7 = 14.3% probability. The same calculation in fractional is denominator divided by the sum of numerator and denominator, multiplied by 100 – so 6/1 is 1/(6+1) = 14.3%. American positive odds use 100 divided by (the American odds plus 100), so +500 is 100/600 = 16.7%. American negative odds use the absolute value of the American odds divided by (that absolute value plus 100), so -150 is 150/250 = 60%.
For first basket bets the practical reality is that you are almost always working with positive American odds (long-priced players) or fractional odds longer than evens. So the conversions you need to memorise are roughly: 4/1 = 20%, 5/1 = 16.7%, 6/1 = 14.3%, 8/1 = 11.1%, 10/1 = 9.1%, 12/1 = 7.7%, 15/1 = 6.25%, 20/1 = 4.8%. Memorising this column means you can read any UK first basket price and convert it in under a second without reaching for a calculator.
+400 decoded – the favourite-tier first basket price
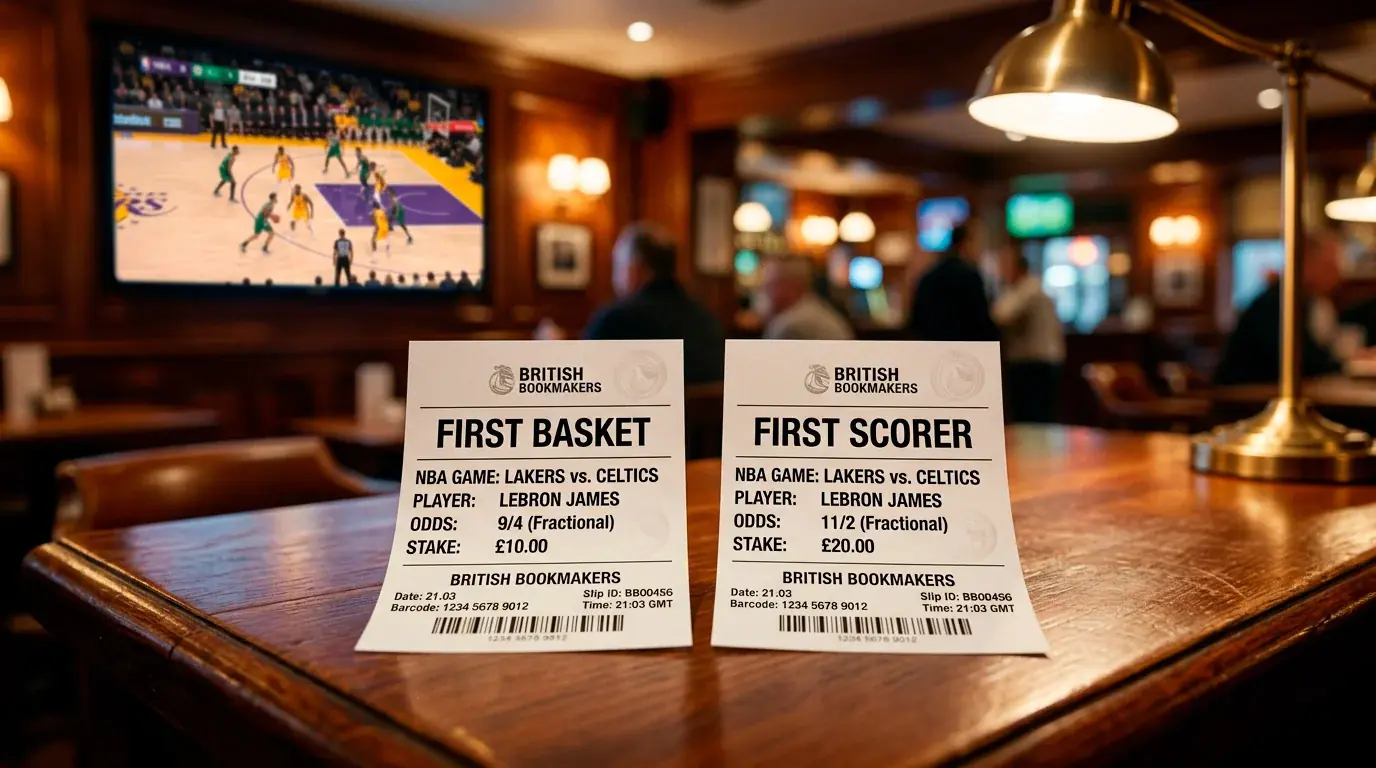
+400 American odds are equivalent to 4/1 fractional and 5.00 decimal, and the implied probability is exactly 20%. On a UK first basket market, +400 is the tier reserved for the very shortest-priced players – typically the franchise centre on a strong-tipoff team, or the elite scoring guard on a team with rigid opening-play scripting.
The 20% implied probability sounds modest until you remember that even the most likely first basket scorer in any given game converts at less than 20%, while a player priced as 15% likely to score first will miss roughly 85% of attempts. That benchmark is the single most important calibration point in first basket betting – if a UK book is offering you +400 on a player whose actual first basket conversion rate is 18%, you are paying for 20% probability and getting 18%, which means you are losing money on every bet over a long enough sample.
The trap with +400 prices is that they feel like favourites, and bettors instinctively trust favourites. But the math is brutal: you need the player to convert above 20% over a long sample to break even at +400. Very few NBA players sustain that rate. Wembanyama in his 2025-26 playoff sample managed 20.7% across 58 starts; Brunson sat at 21.2% across 80 starts. Both are right on the +400 break-even line, and both are still high-risk bets at that price even though they are the closest to true favourites the market has.
+800 and +1500 – the longshot zone where most volume sits
+800 American is 8/1 fractional and 9.00 decimal – implied probability of 11.1%. +1500 is 15/1 fractional and 16.00 decimal – implied probability of 6.25%. These prices cover the broad middle of the UK first basket market: starting forwards, second-tier guards, big-name reserves who occasionally start.
The longshot zone is where pricing inefficiency is biggest because the books have less confidence in their own model. A first basket conversion rate of 11.1% is hard to verify with confidence even over an 82-game sample – you are working with somewhere around eight to ten first baskets per player per season, which is too small a sample for the operator to be confident their model is accurate. The result is that the +800 to +1500 zone often contains the widest gap between the book’s price and the player’s actual fair value.
The mathematics is also more punishing on misses in the longshot zone. At +400 a 10-bet losing run dents your bankroll significantly but recoverably. At +1500 a 30-bet losing run is statistically unremarkable for a player priced at 6.25% probability – and yet most casual bettors would interpret that streak as proof the strategy is broken. It is not. It is exactly what 6.25% probability looks like over a moderate sample.
The other thing to watch in the longshot zone is the spread between books on the same player. UK operators frequently disagree on +1500 lines by 3/1 to 5/1 – which is a meaningful percentage of implied probability. If you are running your own first basket conversion rate model, the longshot zone is where your numbers will most often disagree with the book’s, and where shopping prices across operators is most rewarding.
Comparing implied probability against actual first basket conversion rates
The whole point of computing implied probability is so you can compare the book’s price to a real-world reference rate. The reference rate for first basket bets is the player’s FB% – the proportion of his starts in which he himself scored the first basket of the game. If your modelled FB% is higher than the implied probability of the price you are looking at, you have a positive expected value bet. If lower, you have a negative expected value bet.
Wembanyama at 20.7% across 58 starts and Brunson at 21.2% across 80 starts are the two cleanest worked examples available in public data. Imagine you see Wembanyama priced at +600 (14.3% implied probability). The math is direct: 20.7% modelled probability minus 14.3% implied probability equals 6.4 percentage points of edge. Over the long run, that gap is exactly what value betting looks like. Now imagine the same player at +400 (20% implied) – the edge is reduced to 0.7 percentage points, which sits below the typical operator vig and is therefore not actually a value bet.
The rule I follow: I will only place a first basket bet when my modelled probability beats the implied probability by at least 3 percentage points. That margin is roughly the operator vig plus a small cushion for variance in my own model. Anything narrower is not worth staking – too thin a margin to survive variance, even when the math is technically positive.
The vig and overround on first basket markets
UK first basket markets are typically the highest-vig prop on the entire NBA board. Where a moneyline market might run at 4-5% vig, the first basket market often runs at 15-25% vig. Some NBA teams win the opening tipoff over 60% of the time, while others hover around 40% – and the books bake that uncertainty plus a healthy safety margin into the prices, which inflates the overround.
To compute the overround, sum the implied probabilities of every player listed in the first basket market. A fair market sums to 100%. A vigged market sums to more than 100% – and the excess is the operator’s edge. On a typical UK first basket market with 24 players priced, the implied probabilities sum to between 115% and 125%. That excess 15-25% is the bookmaker’s gross margin before the bets even settle.
What this means in practice: even if your model is calibrated perfectly to the league average, you cannot expect to break even by playing every line on the board. You can only beat the market by finding the specific players whose individual implied probability is below their actual fair rate by enough to overcome the 15-25% vig. That is a much narrower edge than most casual bettors realise – and it is why first basket betting is unforgiving territory for anyone who has not done the implied-probability work.
What does +400 implied probability convert to?
A price of +400 American (4/1 fractional, 5.00 decimal) implies a 20% probability. The formula is 100 divided by (American odds plus 100), so 100/500 = 20%. That is the standard conversion regardless of sport or market.
Why is the vig so high on NBA first basket markets?
First basket is a high-variance, high-uncertainty market. Operators do not have confidence in their player-by-player probability estimates, so they pad the overround to protect against modelling error. UK first basket markets typically run at 15-25% vig, which is several times higher than the vig on standard moneyline bets.
Created by the ”nba First Basket Bets” editorial team.